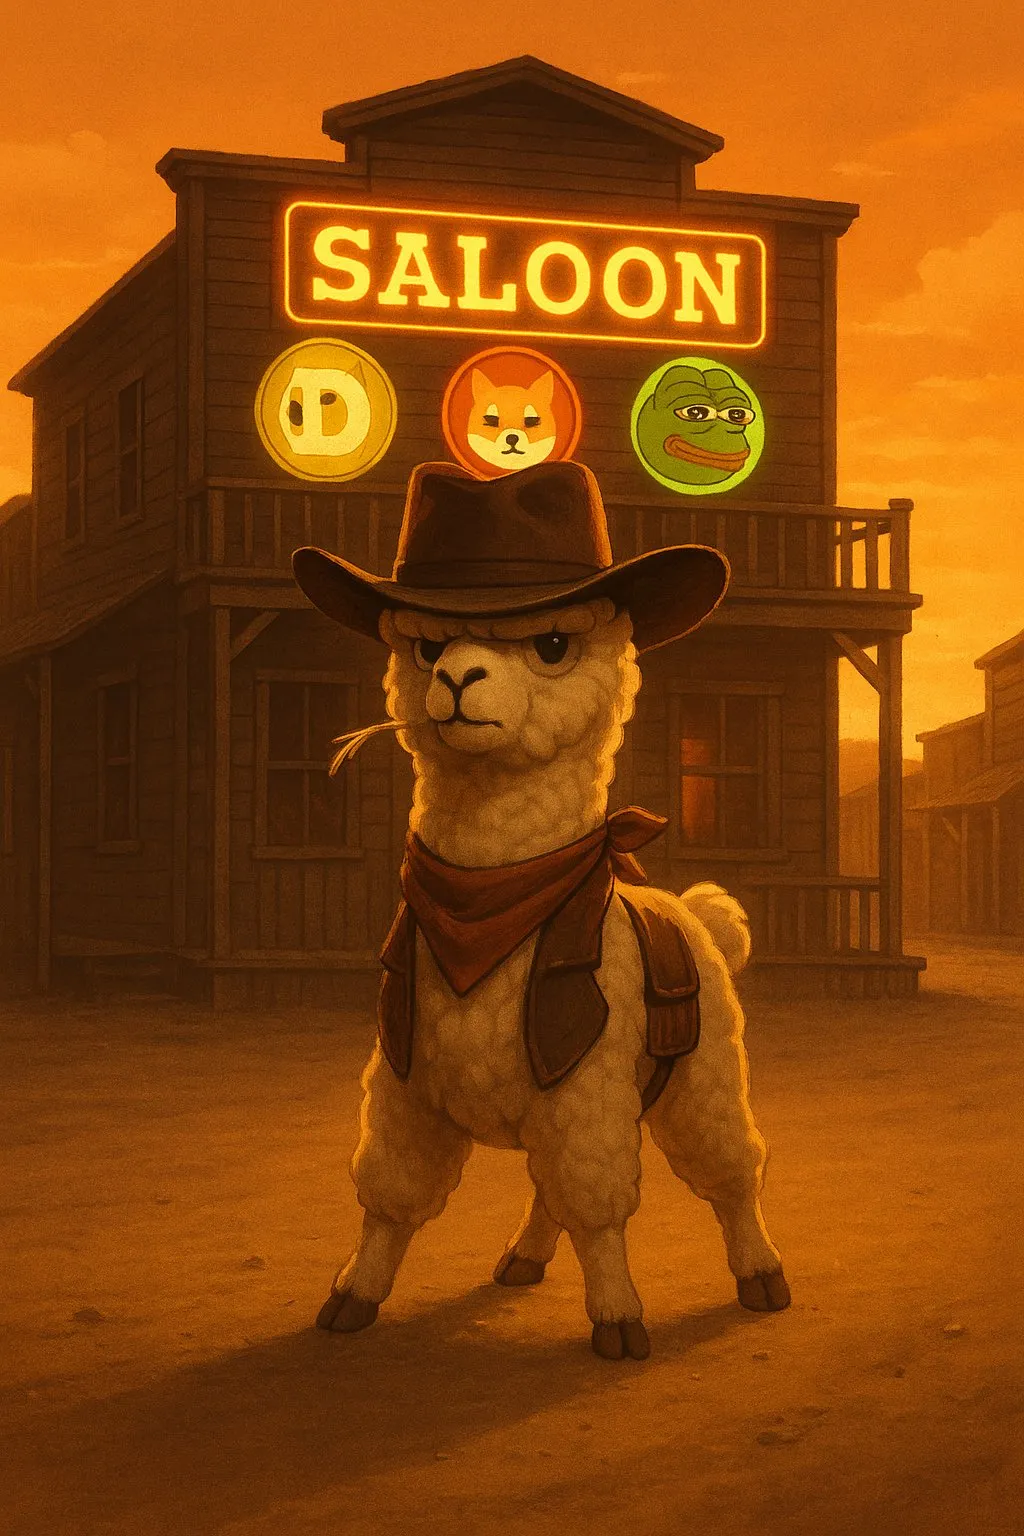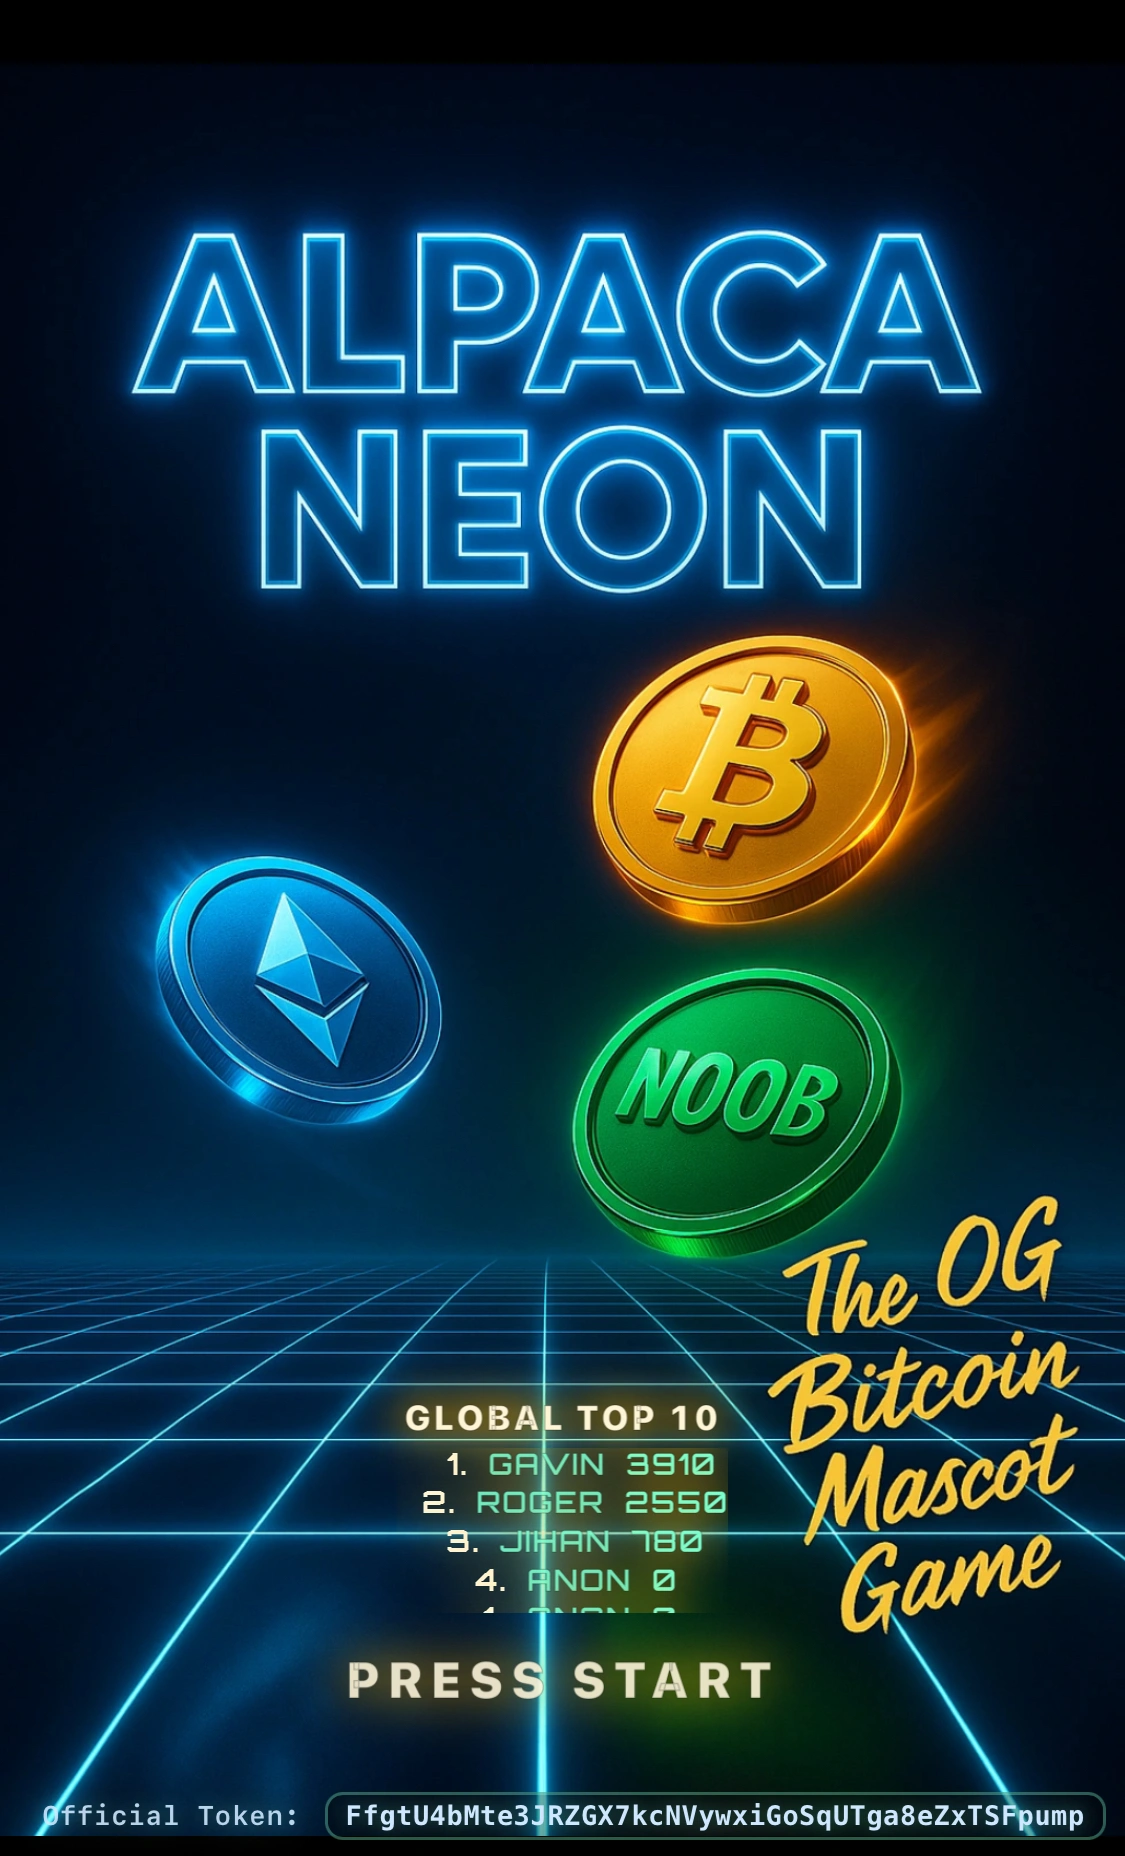



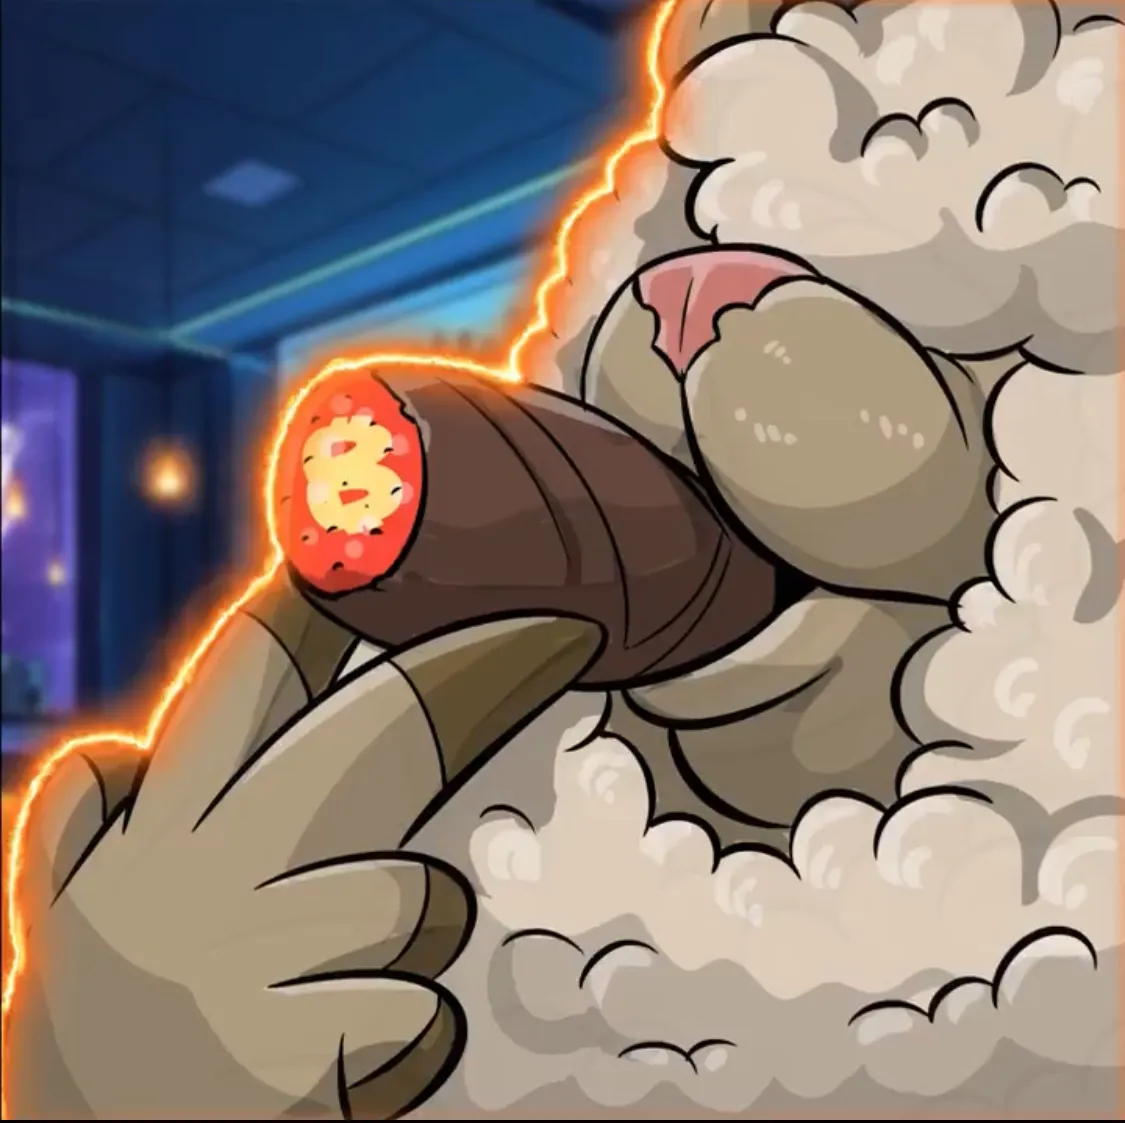


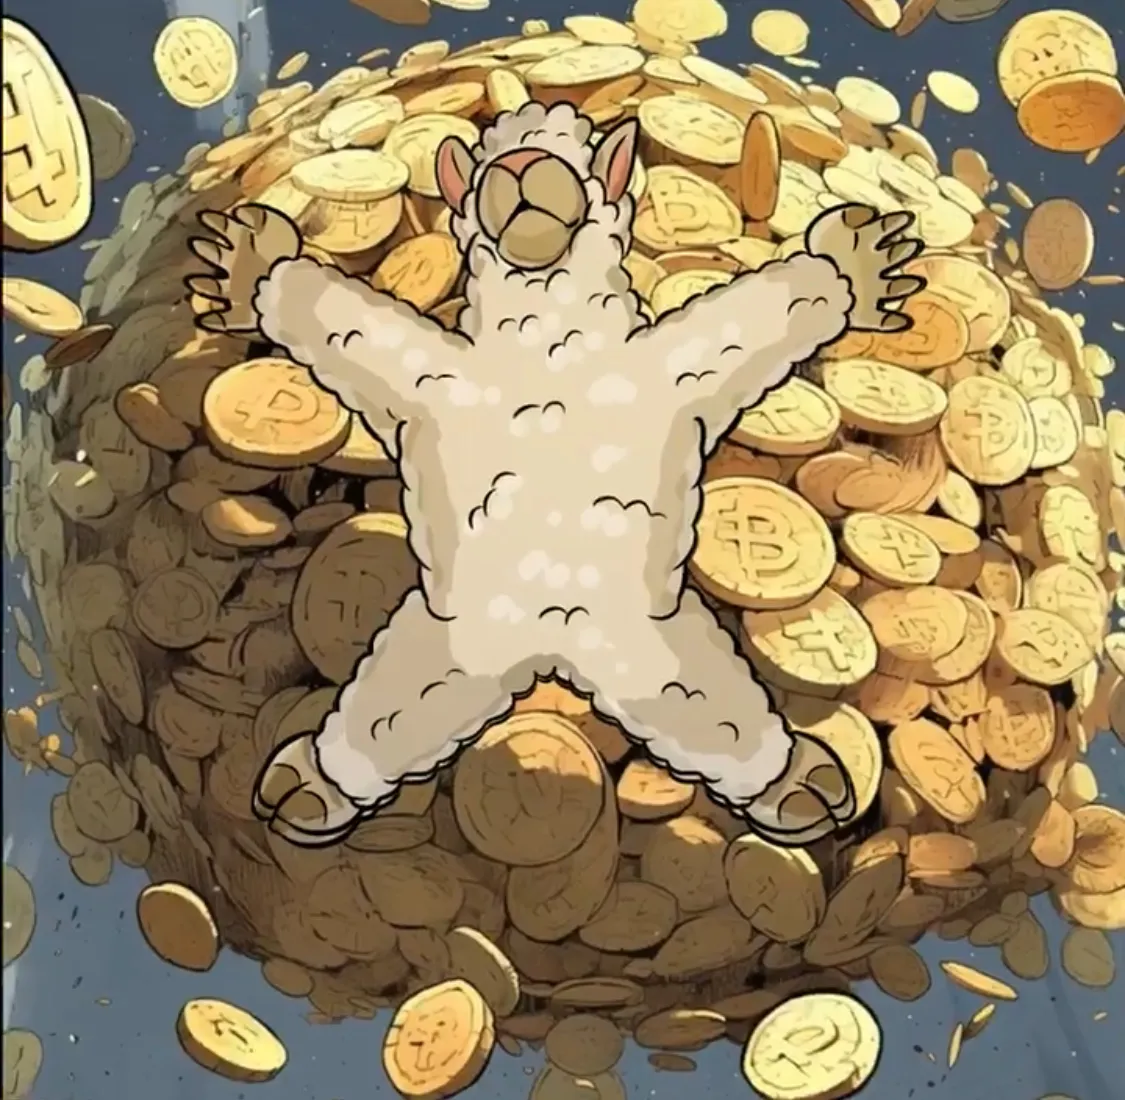
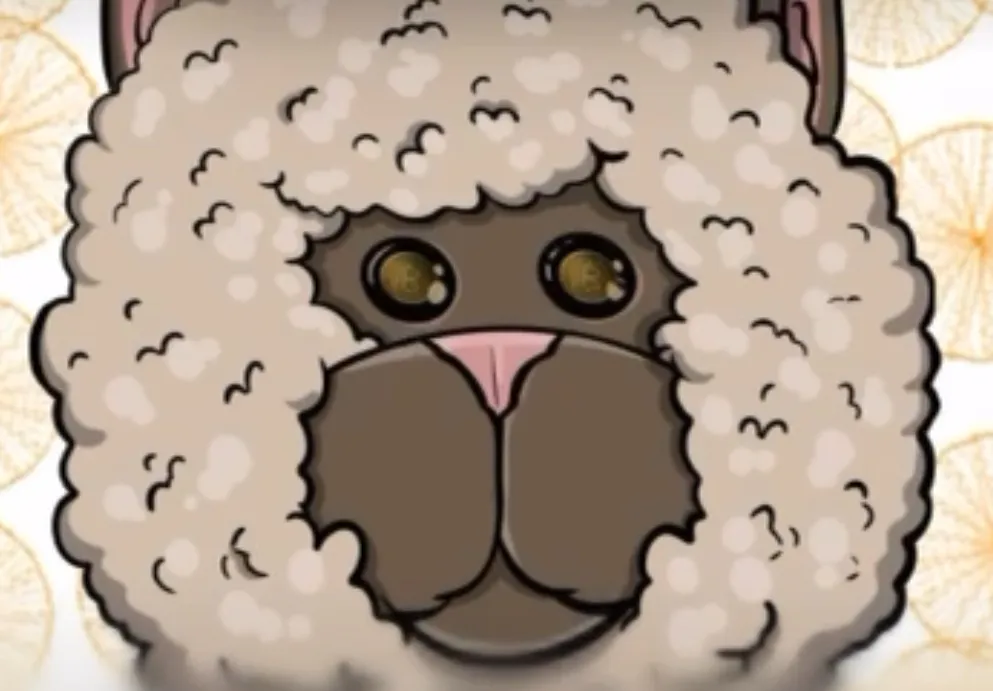


The OG Bitcoin Mascot
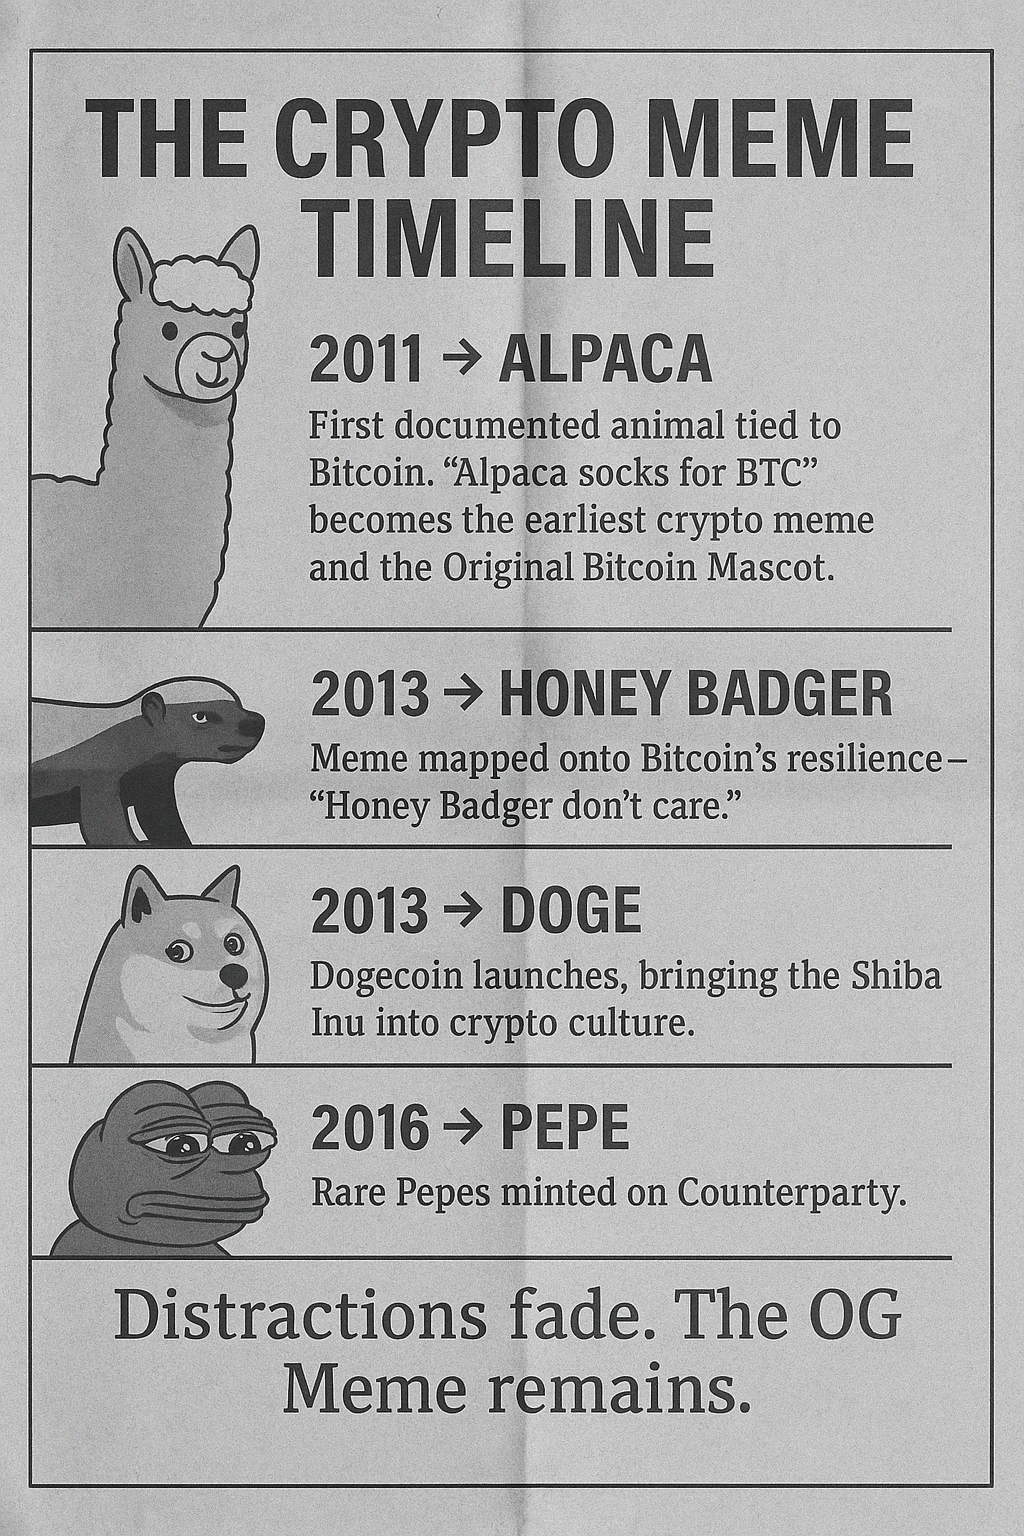
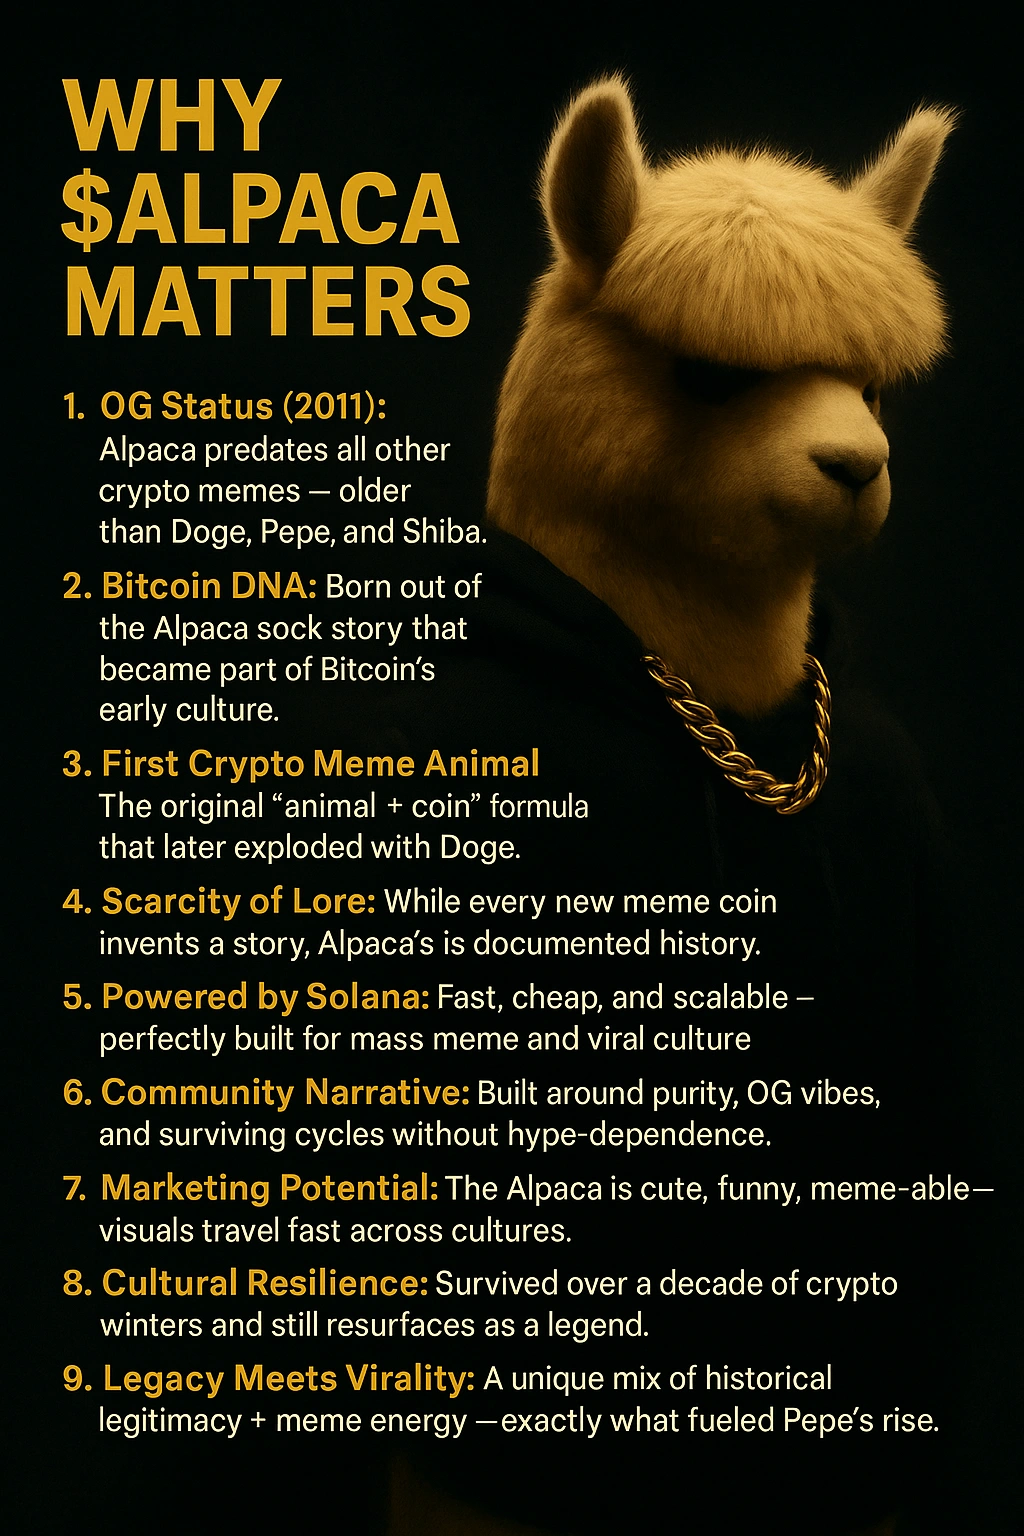


Discover the original roots on BitcoinTalk (2011).
EXTRA FOR THE HERD
Looking to improve your Crypto knowledge and Trading skills?
Learn more about Crypto and Crypface, test yourself with the quiz, and become a Crypto Sentiment Expert
Crypface : the Next Generation pulse of crypto Fear & Greed, in real time.

See what Traders expect
How They Feel
As it happens
Cryptocurrency is a form of digital money designed to be secure, borderless, and decentralized — meaning it isn’t controlled by any bank, government, or company. Instead, it runs on technology called blockchain, which is essentially a public, unchangeable ledger that records all transactions transparently.
Bitcoin was launched in 2009 as a response to the global financial crisis. It was created to give people more control over their money — without relying on banks. Since then, thousands of cryptocurrencies have been created, each with different goals and technologies.
Cryptocurrency isn’t just a speculative asset — it’s an evolving technology stack for ownership, finance, and digital interaction.
Crypface is a mobile-optimized web app that lets users instantly feel the crypto market — all on one single page. Instead of traditional charts and endless metrics, Crypface looks more like a compact crypto cockpit, packed with unique, emotion-driven signals.
It’s designed to help users feel what the market is experiencing — whether it's excitement, fear, hesitation, or aggression — without needing to interpret complex data.
Crypface addresses a key limitation in most crypto dashboards: while they display price and volume, they often fail to show what traders are thinking, feeling, or expecting. Crypface bridges that gap by focusing on sentiment, mood, and conviction — turning raw data into an emotional read of the market.
It offers a unique way to see market sentiment and mood evolve in real time, using original indicators you probably won’t find anywhere else. But Crypface doesn’t stop at analysis — it gives users a voice. You can broadcast your favorite ticker or drop your "Feeling of the Day" to the entire world, instantly.
More than a dashboard, Crypface delivers a futuristic experience — one that sits at the frontier between gaming and finance. It’s not just about watching the market... it’s about feeling it, reacting to it, and becoming part of it.
Crypface isn’t built for passive observation — it’s designed to be felt and interacted with. As people vote their sentiment, share their mood, "chill" their ticker, and "drop" their personal sentence, they feed the emotional engine of Crypface. "The more people use it, the more alive and captivating it becomes — attracting even more users and creating a powerful virtuous cycle."
It’s not a dashboard — it’s a cockpit. One shaped by a creator who merges a deep passion for trading psychology and video game aesthetics. The result: a high-performance tool that’s also immersive, expressive, and surprisingly fun to use.
Legends never die...
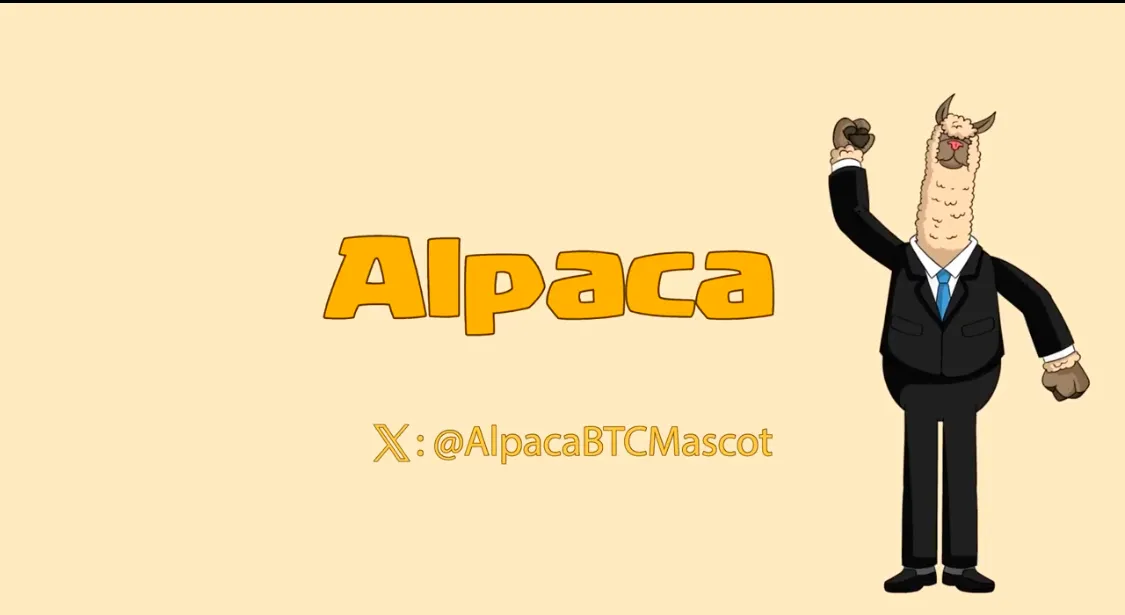
Independent, Community-Driven Project
This website is an independent, community-driven initiative created for informational, entertainment, and creative purposes.
It celebrates the Alpaca meme and its cultural story and operates entirely independently from the original token smart-contract deployers or on-chain developers.
No Financial, Investment, or Legal Advice
All content on this site is for informational and entertainment purposes only. Nothing constitutes financial, investment, or legal advice. Users should consult qualified professionals and proceed at their own risk.
High-Risk Nature of Meme Tokens
Meme tokens are speculative, highly volatile, and may become worthless. Users should never invest more than they can afford to lose.
No Control Over Smart Contracts
This site does not control the Alpaca smart contracts or blockchain behavior. Interactions are at the user’s sole risk.
No Endorsements or Official Affiliation
This project operates independently and is not endorsed by any exchange, wallet provider, or external organization.
Any third-party links or references are provided purely for informational purposes.
Regulatory & Compliance Disclaimer
Users are solely responsible for compliance with applicable laws in their jurisdiction. This website offers no legal assurances or compliance guarantees.
No Warranties or Guarantees
All content and features on this site are provided in good faith for community enjoyment.
While accuracy and stability are carefully maintained, users should understand that content is offered as-is and may evolve over time.
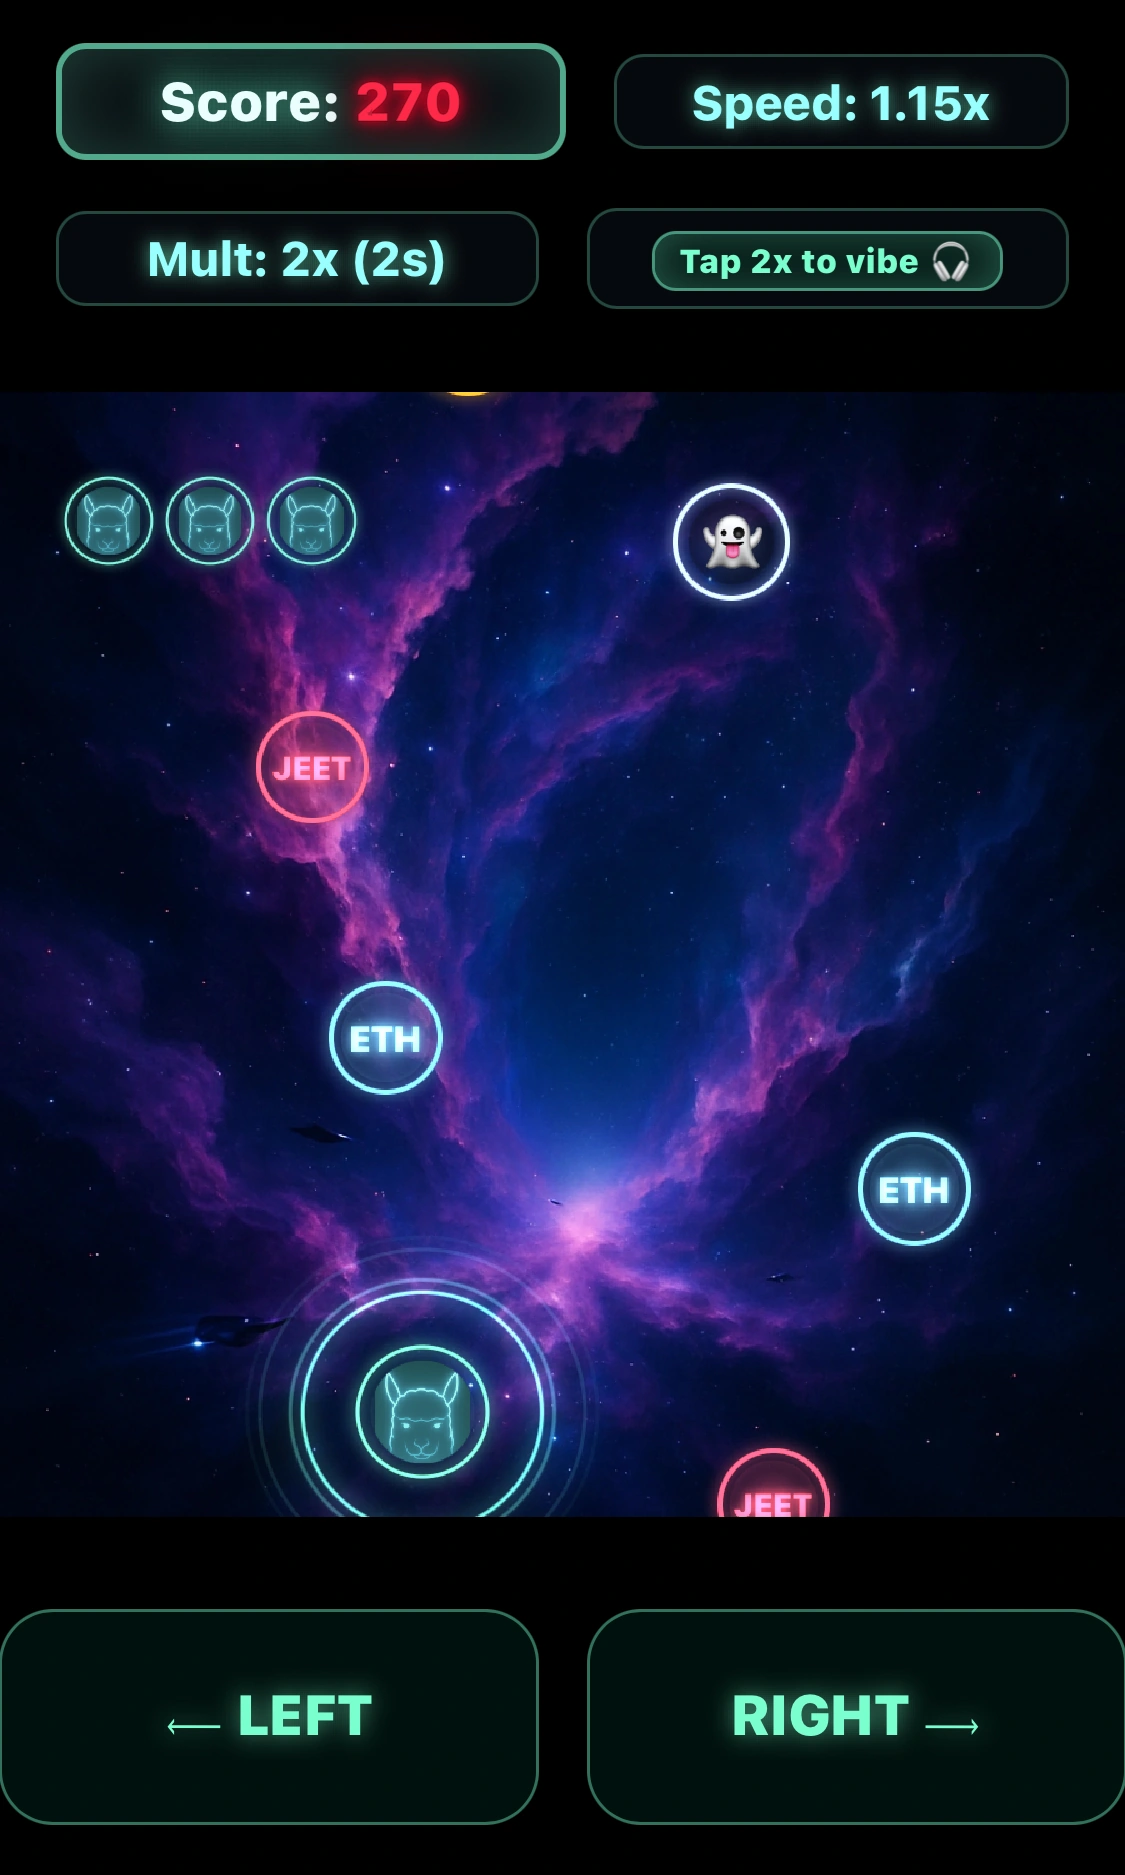
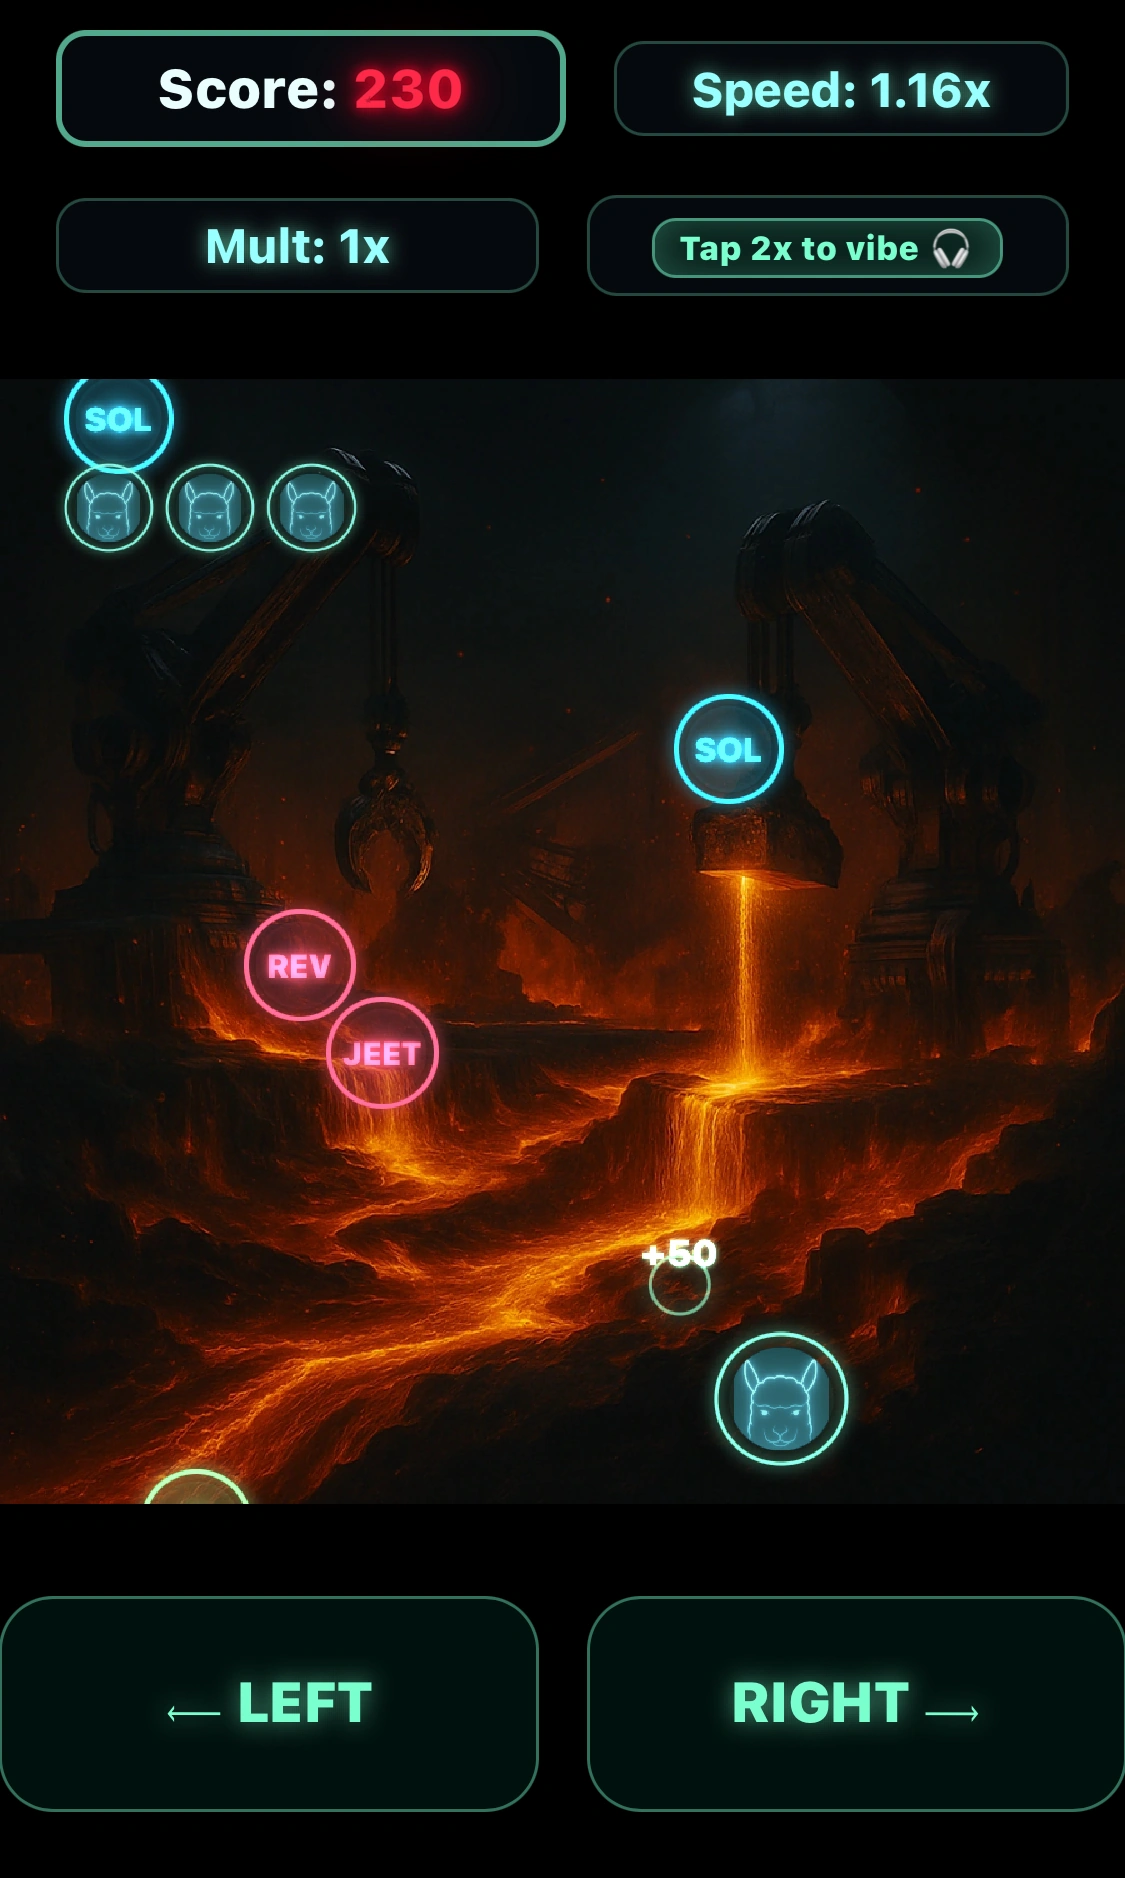
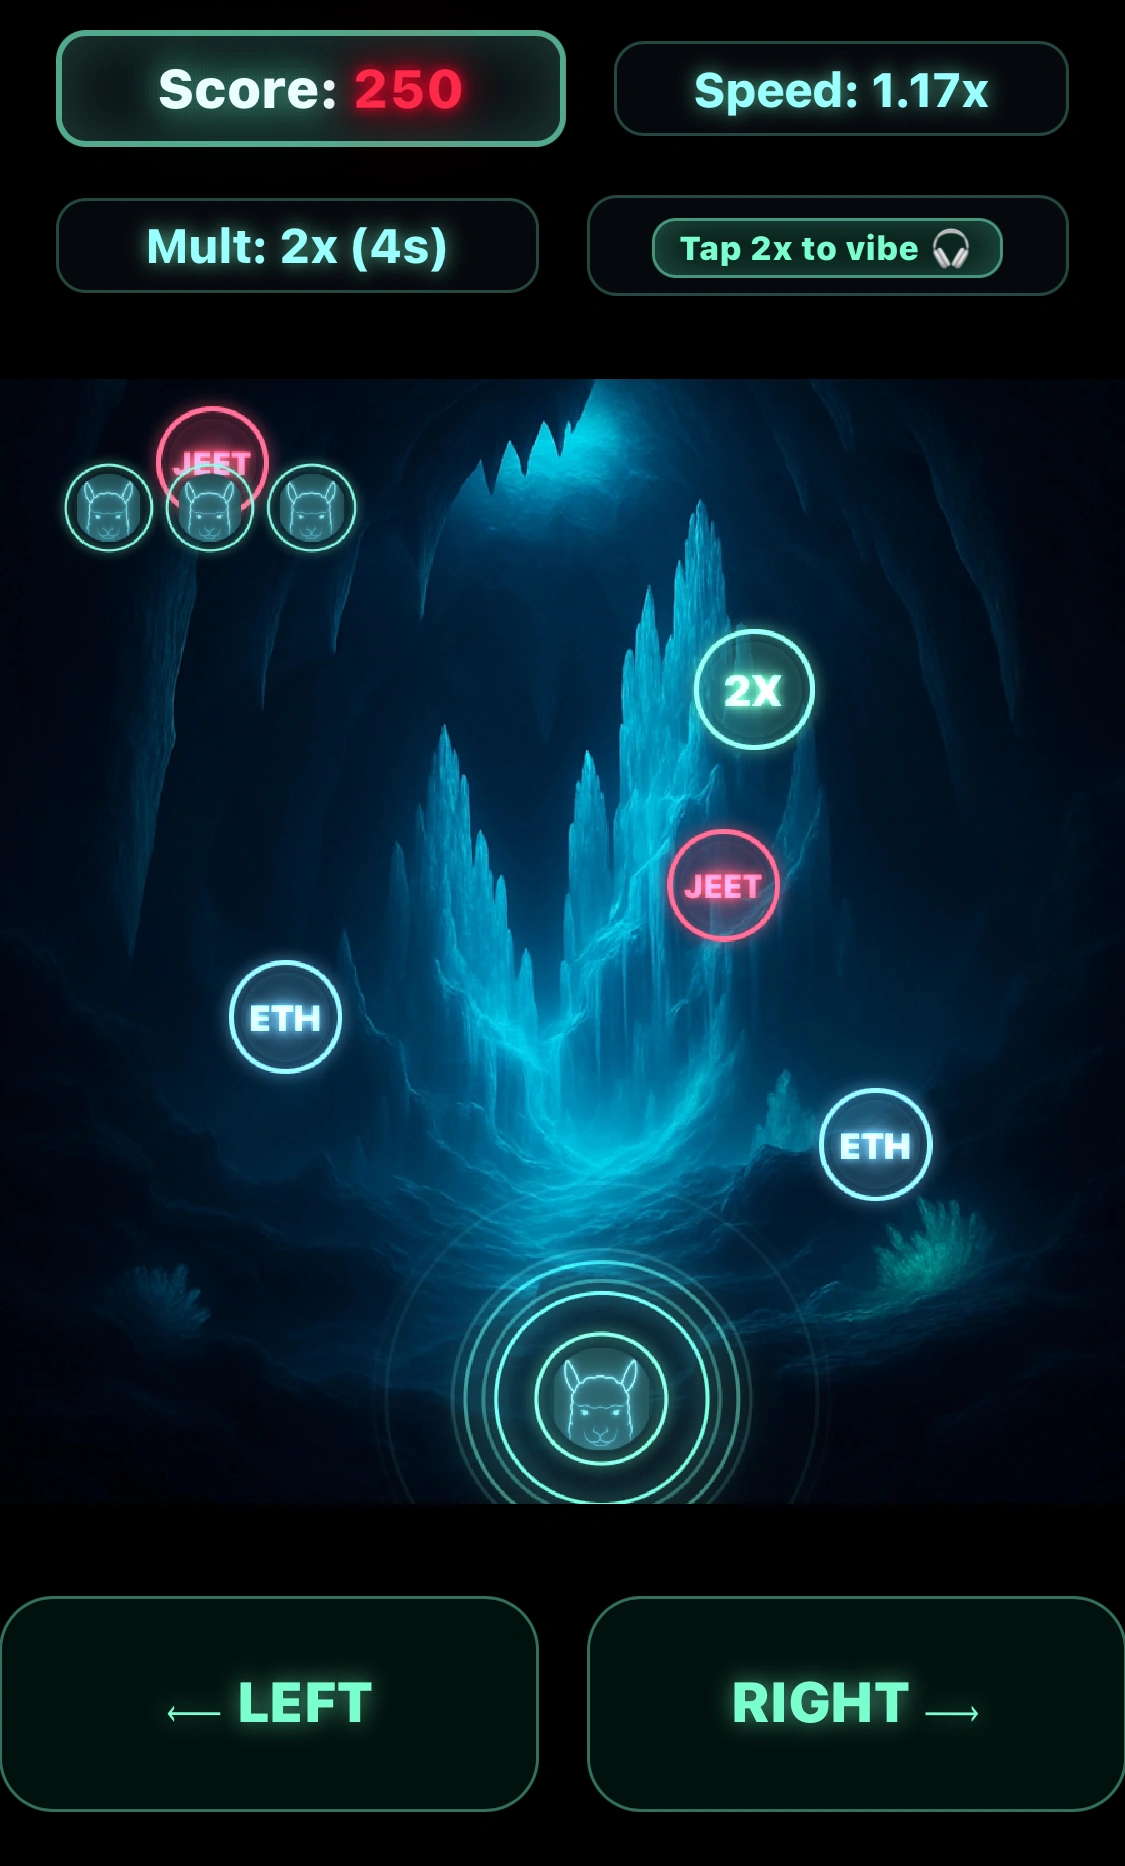
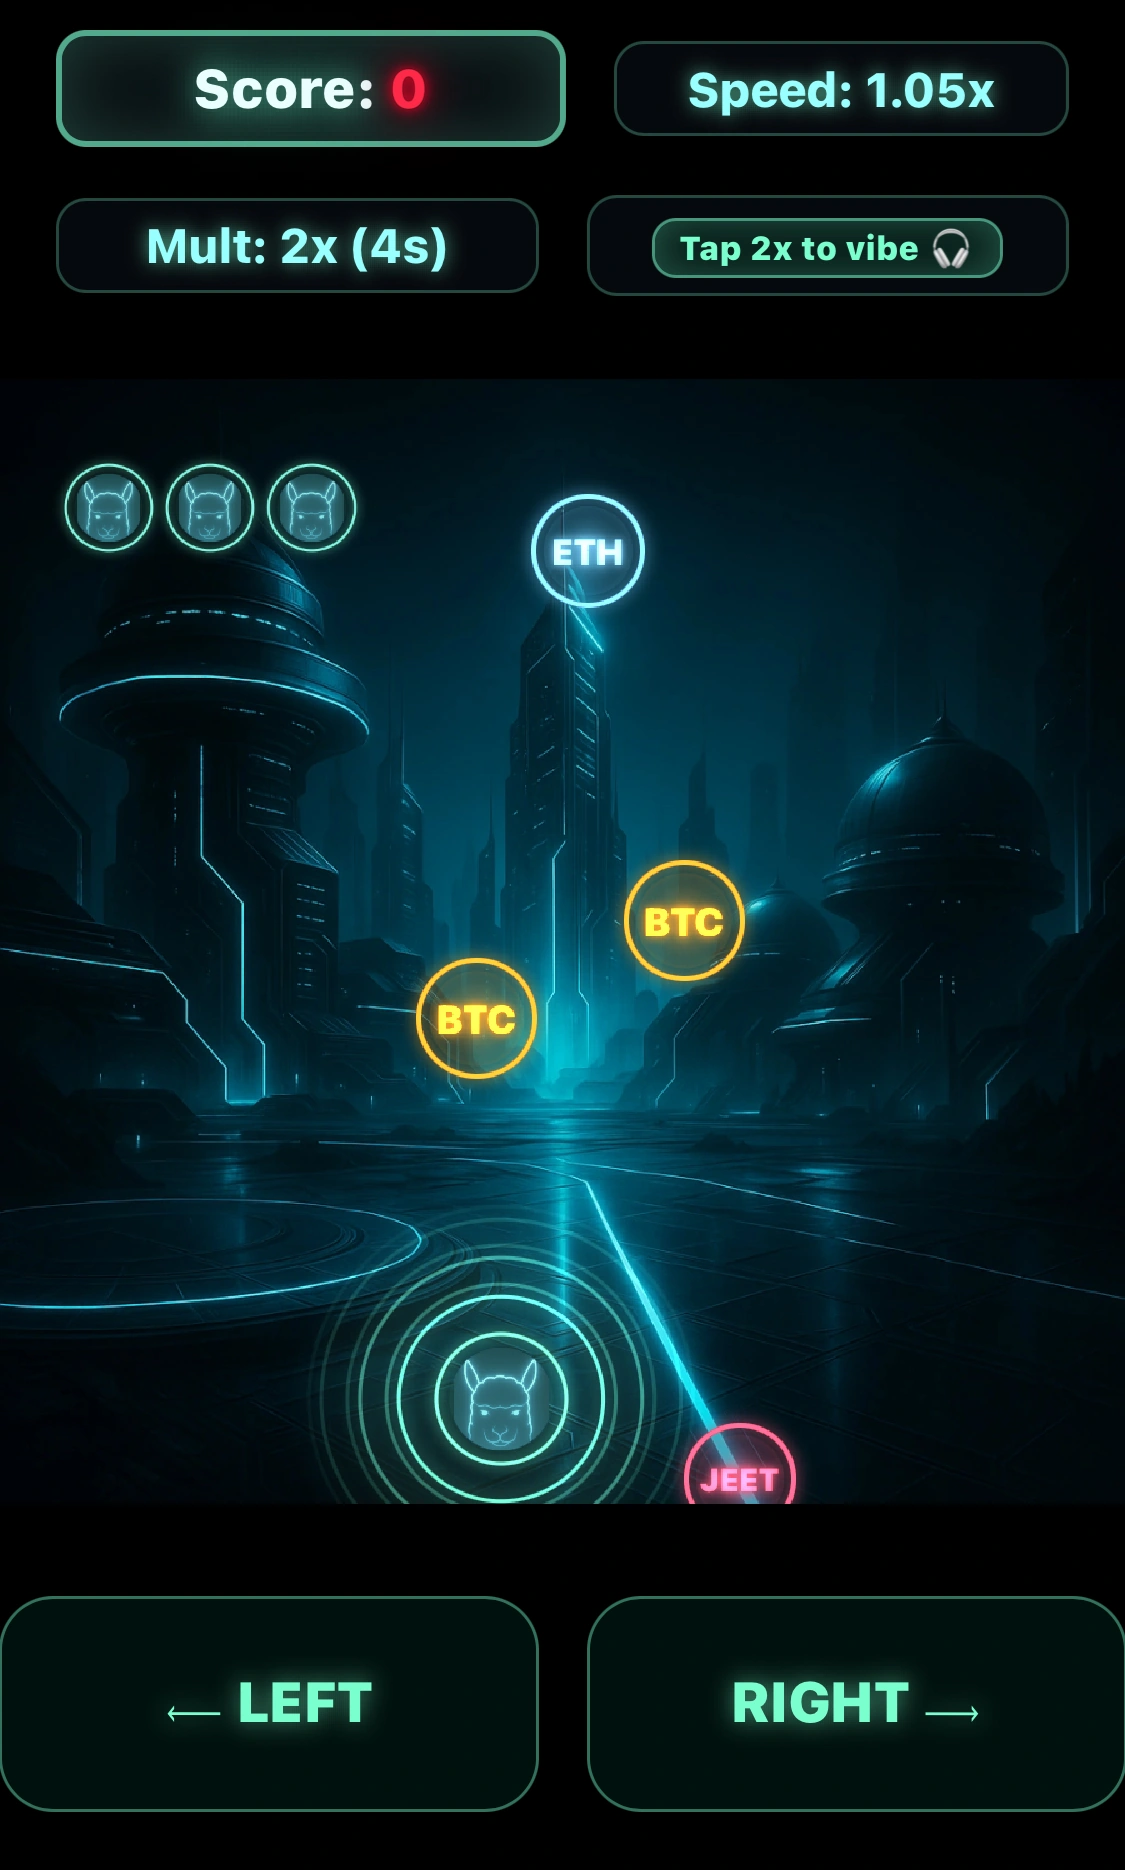
ALPACA NEON Game
ALPACA NEON is a free browser-based game developed by the community as part of the ALPACA Project’s creative universe. It requires no downloads, contains no hidden code, and runs securely in your browser.
The game is designed purely for fun and community engagement. It does not involve money, trading, or any form of financial activity. Gameplay data such as scores or nicknames may appear on public leaderboards only if users choose to participate.
All visuals, sounds, and concepts belong to the ALPACA Project and are used under fair and royalty-free terms.
Token Information Notice
The display of the official Alpaca token contract address within the game or on this site is provided solely for transparency and identification. It does not constitute an offer to sell, a solicitation to buy, or any form of financial promotion.
Final Terms & Acknowledgment
By using this website, you acknowledge and accept all terms outlined in this disclaimer.

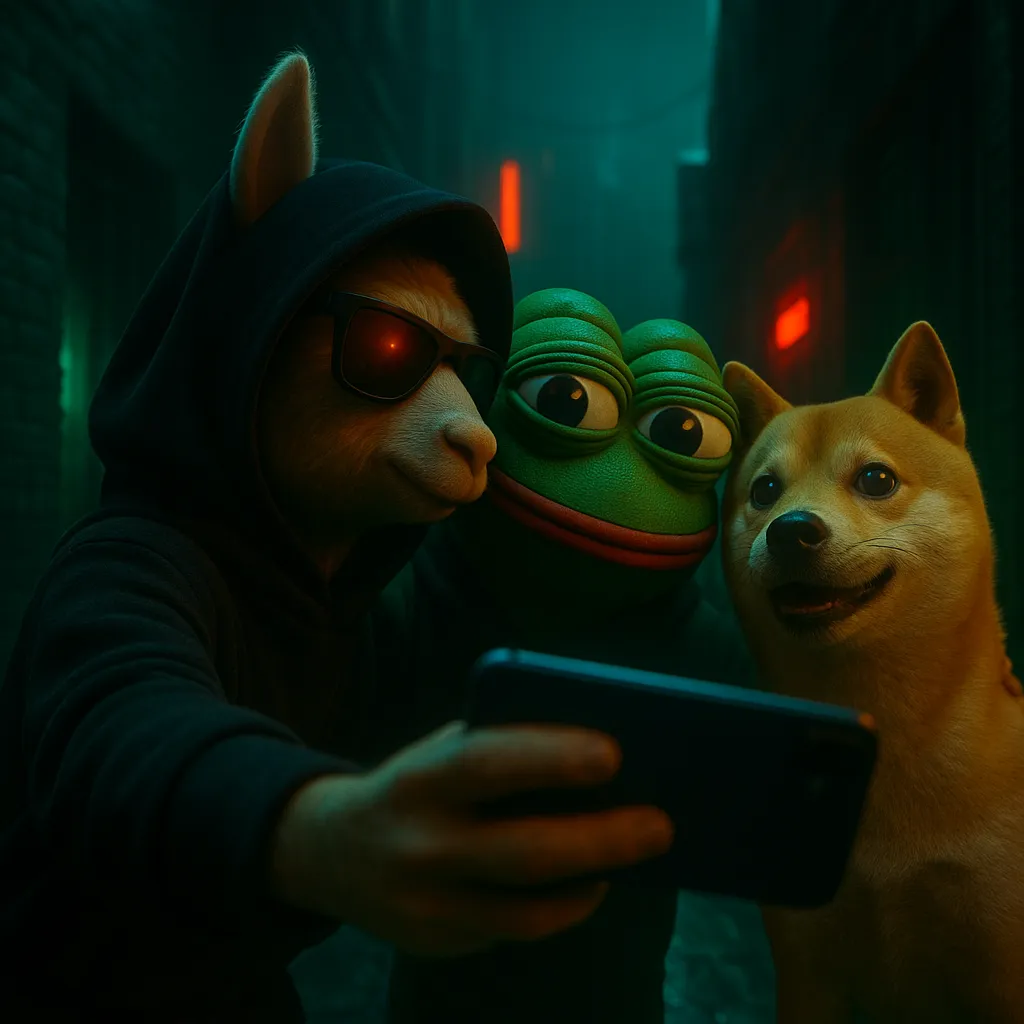
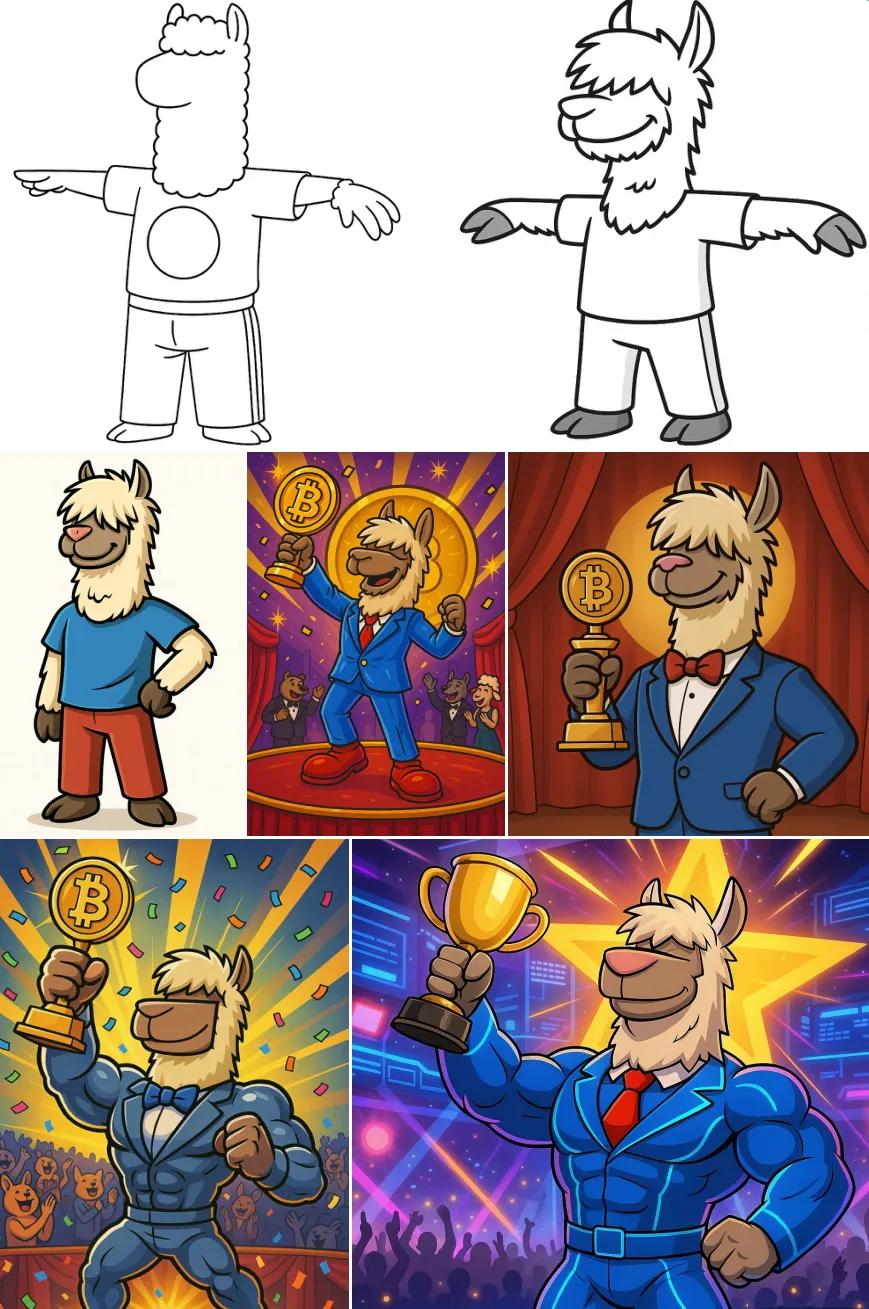
Before dogs and frogs flooded crypto… there was THE ALPACA.
It wasn’t just an image — it was a moment. Back in 2011, Bitcoin was young and untested. It was little more than an idea — a spreadsheet, lines of code shared among cypherpunks. One bitcoin wasn’t even worth $1.
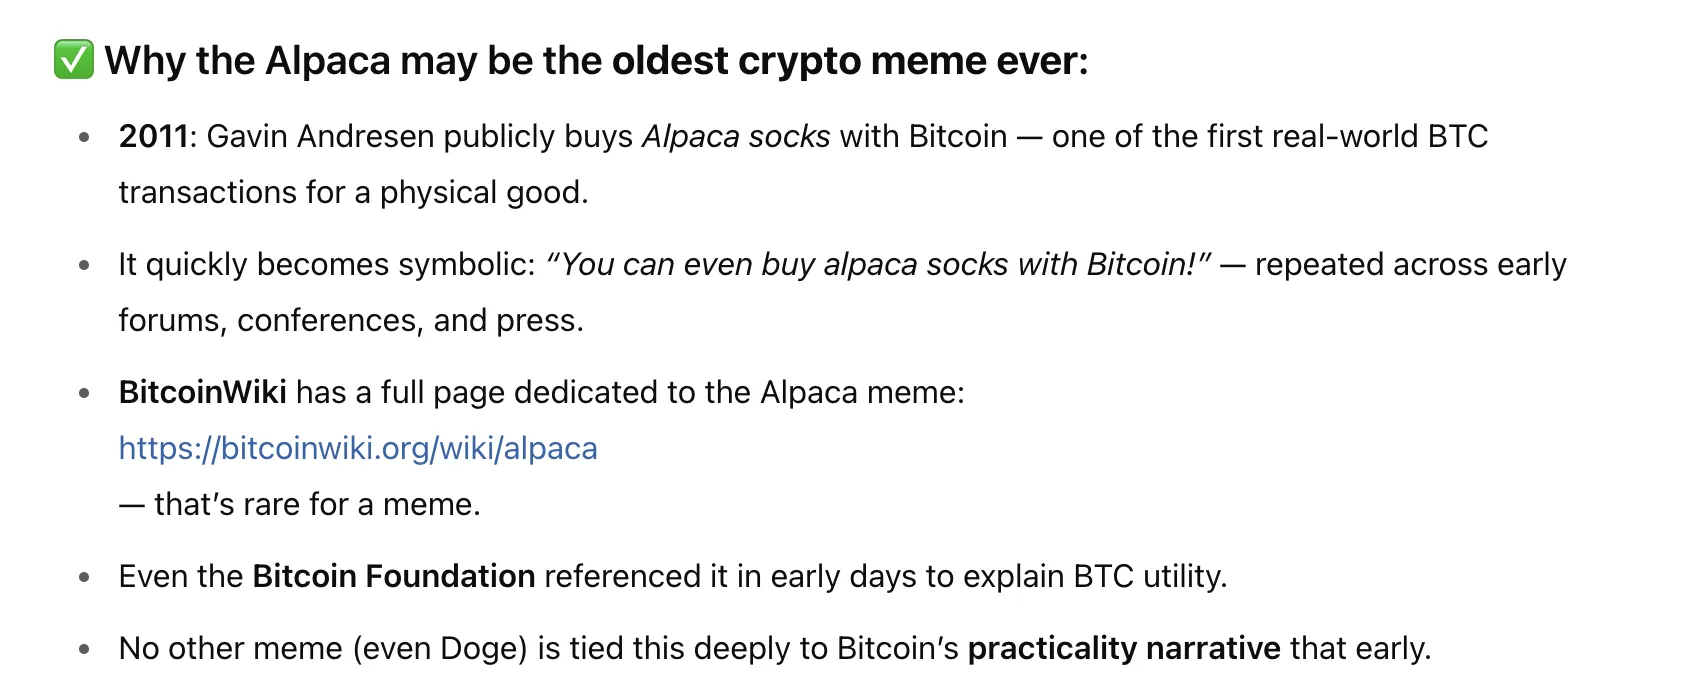
Then something extraordinary happened. Bitcoin pioneers highlighted a real merchant called Grass Hill Alpacas, one of the first shops in the world to accept Bitcoin. For the first time, Bitcoin wasn’t debated — it was used. People could buy something real: alpaca wool socks. The price? 50 BTC.
What sounded almost laughable at the time turned out to be monumental. That simple transaction proved Bitcoin wasn’t just theory or code — it worked. This fluffy creature helped Bitcoin cross from experiment to reality.
When legendary Bitcoin core developer Gavin Andresen publicly purchased alpaca socks using Bitcoin, the story went viral. The image of a single, wide-eyed Alpaca spread rapidly — through forums, early Bitcoin communities, Sladshot mockups, and social media.
That humble creature grew into something bigger: a marker of legitimacy, a spark of belief — and arguably the first true crypto animal meme. The ALPACA wasn’t speculation. It was proof.
The story didn’t stay underground. Major publications like Forbes and Wired picked it up. Long before laser eyes, cycles, or slogans, this unassuming animal quietly marked the moment Bitcoin became real.
In today’s crypto landscape, few memes have a real origin — and roots this deep.
ALPACA is different.
It represents utility, resilience, and the moment Bitcoin stopped being “just code.”
Few people know that.
Now you do.
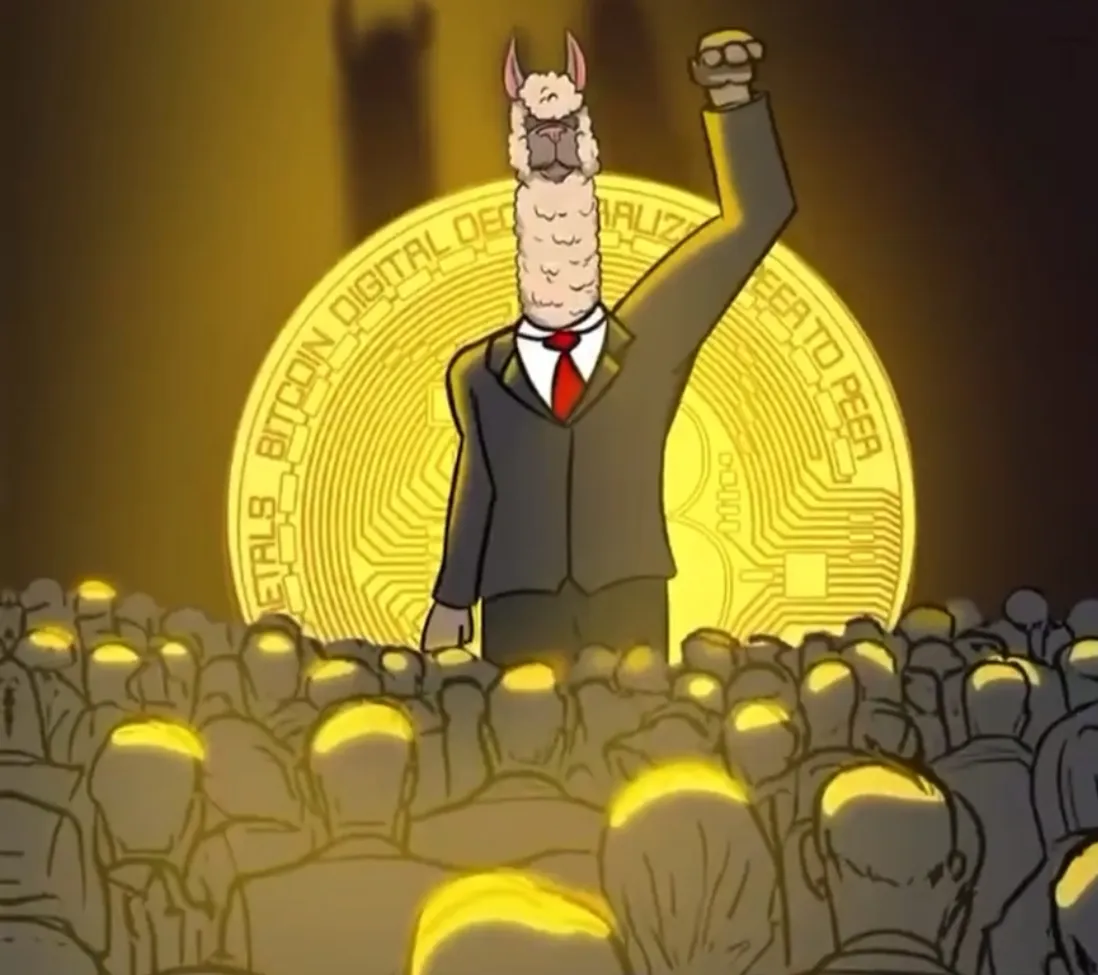
Inspired by early Bitcoin history and reporting from sources including DailyCoin, Forbes, Wired, and the Bitcoin Wiki. Special Thanks to The Curve Animation for the creation of the original mascot design.
Community Content


